

Check the observation details
Start with the student, date, recording method, setting, and observation length. Read Context and the observation notes before interpreting the charts. An interruption or a change in activity may explain a pattern that the chart alone cannot. Select the setting or Context text to edit it. If the field has a Save button, select it to keep the change. To correct a score, event, or episode, use the editing controls for that record, described below. Editing Context does not change the recorded measurements.Read the results for your method
Jump to Interval, Anecdotal, ABC, Frequency, Duration, or Latency.Interval
Interval Summary shows the percentage of scored intervals in which each behavior met the recording rule. Read the result using the variant you recorded:- Partial Interval: the behavior occurred at some point in the interval.
- Whole Interval: the behavior occurred throughout the interval.
- Momentary Time Sampling: the behavior was occurring at the sampling moment.
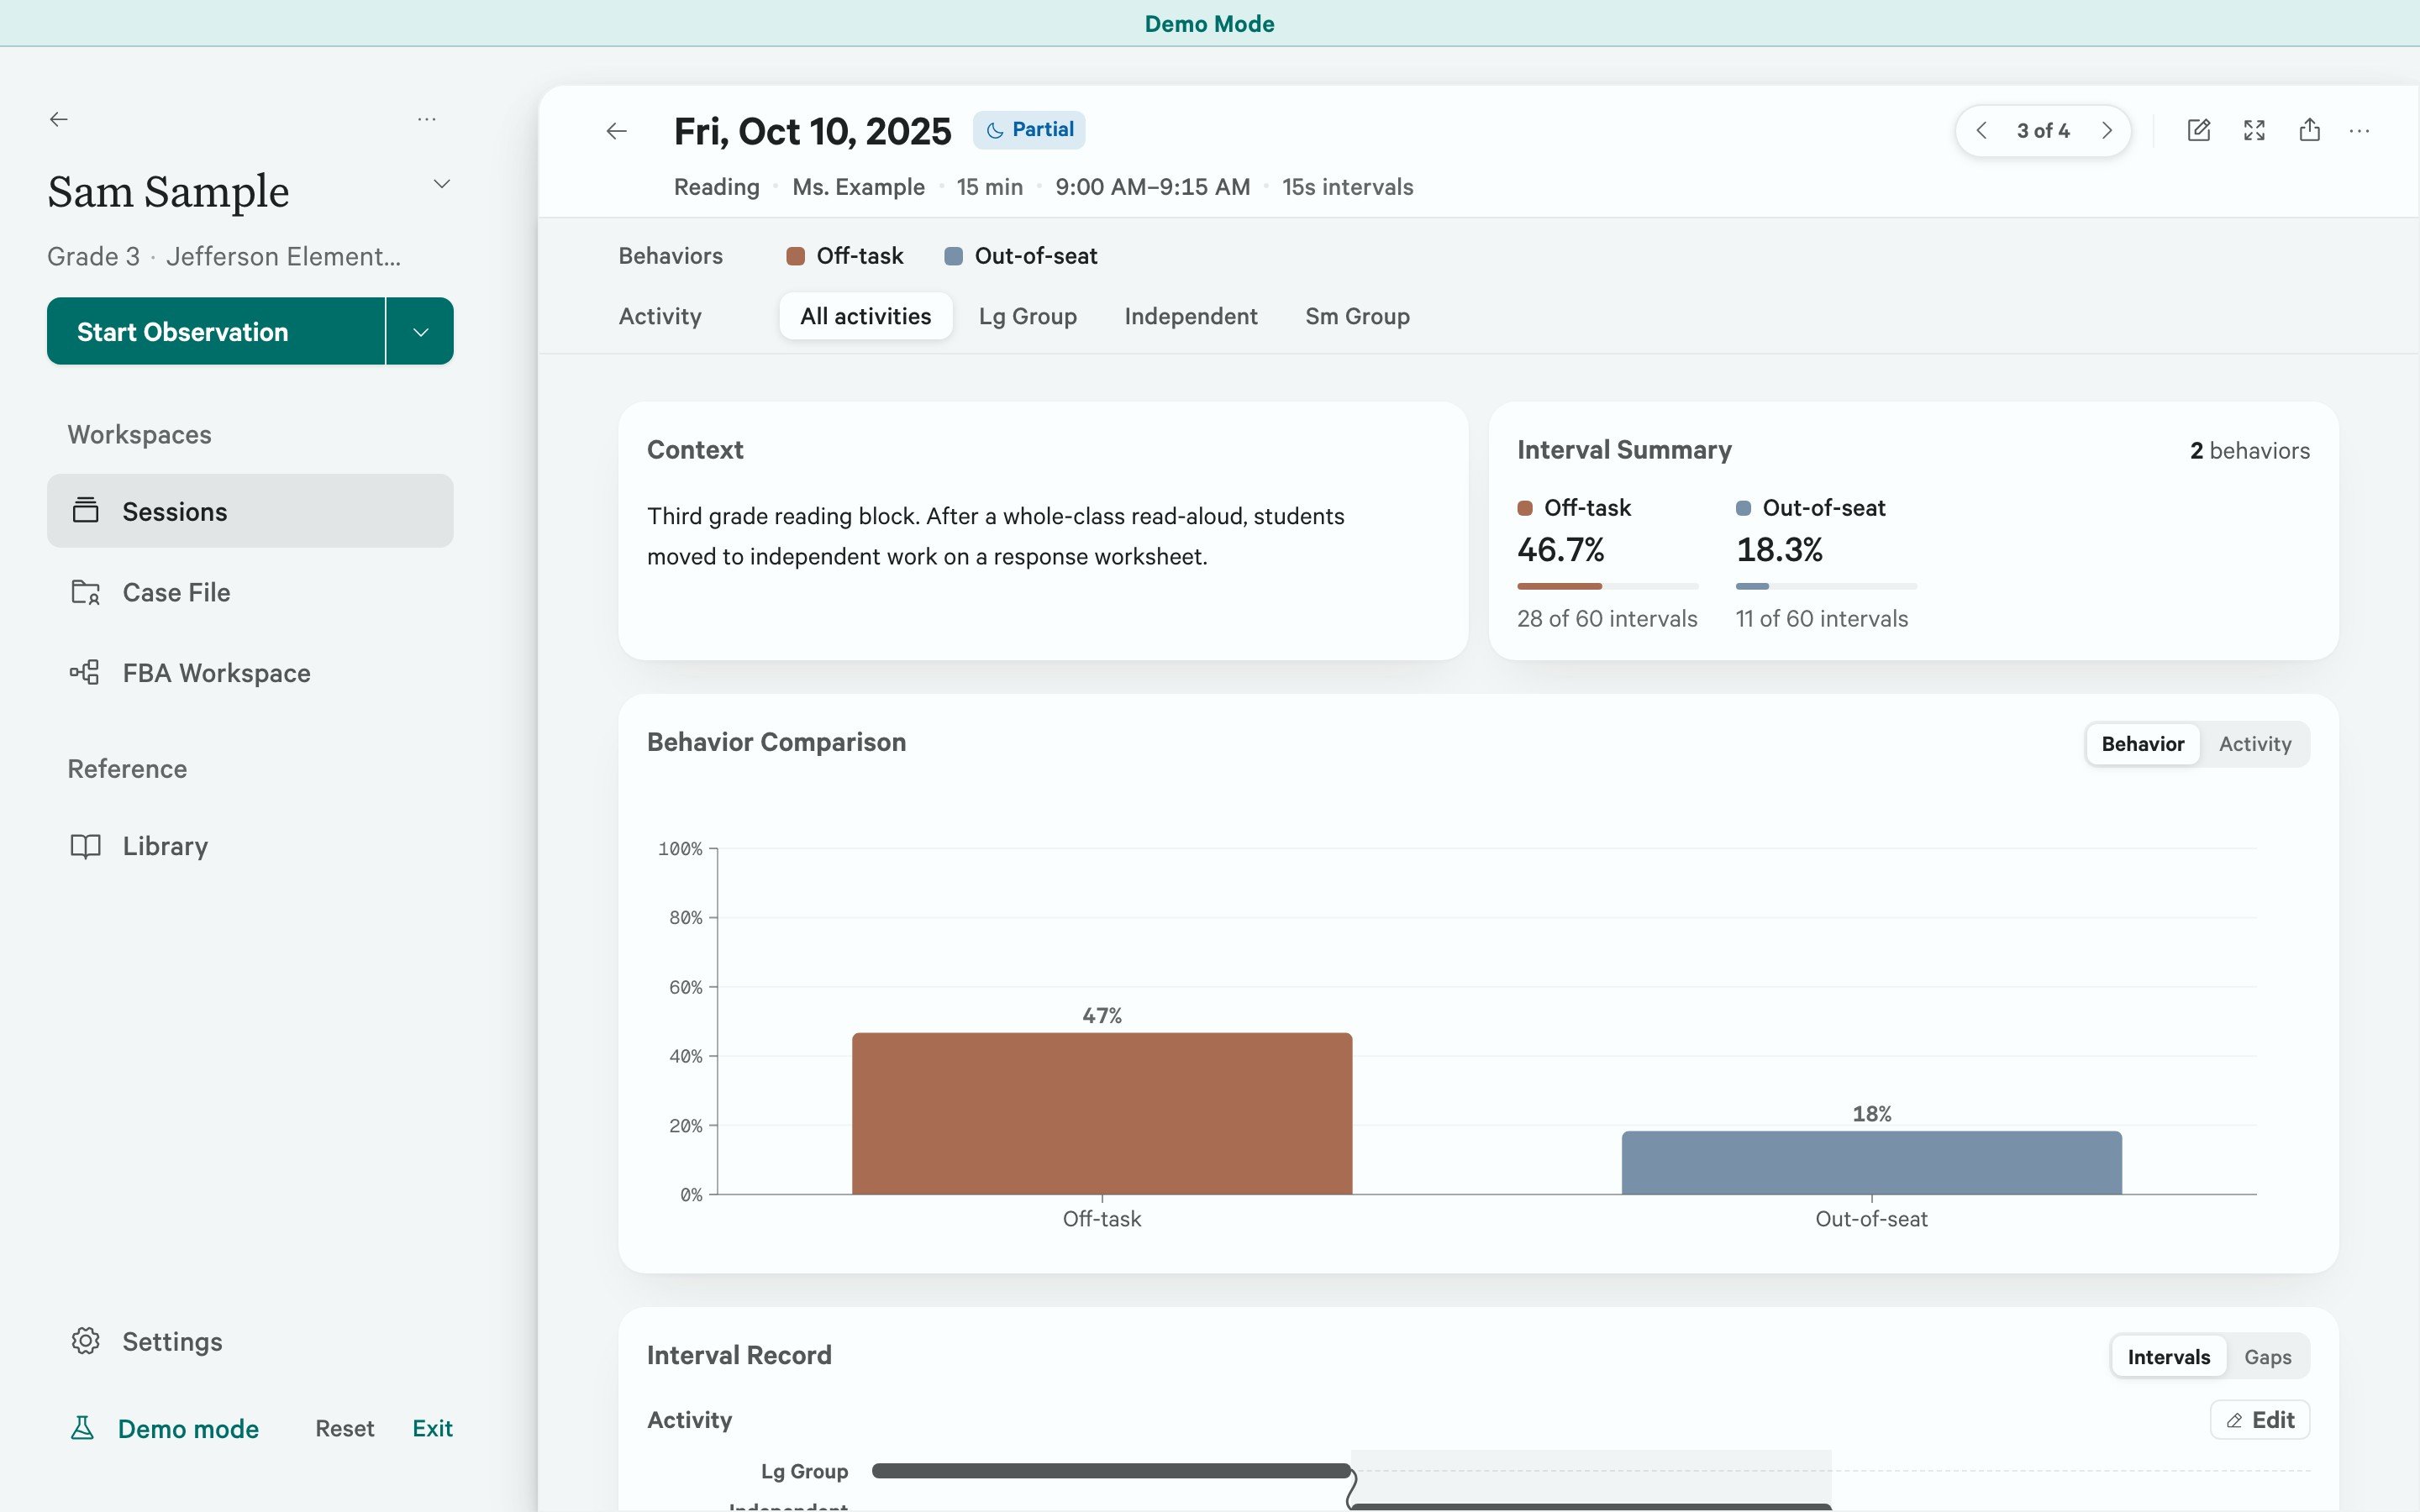
A sample partial-interval observation with All activities selected. Read each summary against its scored intervals, then inspect the individual scores in Interval Record.
Gaps and runs
Partial Interval offers Gaps between intervals marked ✓. Whole Interval offers Runs of consecutive intervals marked ✓. These views show patterns across intervals, not the exact times when a behavior started or stopped. ≥ means “at least.” It marks a gap or run whose full length is unknown because it reaches a boundary or a break in scoring. These incomplete values are excluded from the average.Anecdotal
Read Context for the surroundings, then Observation log for student actions at particular moments. The log shows entries with their elapsed times, oldest first. General notes follows as a bulleted list of student behavior across the session, including ongoing behavior and behavior that did not occur. An activity filter shows only that activity’s log entries; general notes remain visible. A tag identifies the subject of an entry. The number of tagged entries is not a behavior frequency unless each occurrence was recorded separately. Correct an entry’s wording in the record if needed. Preserve the distinction between what you directly observed, what someone said, and your interpretation when preparing a write-up. See Correct or add anecdotal notes.ABC
Events by Behavior shows how the recorded events are distributed across behaviors. The Antecedent → Behavior → Consequence display helps you see which sequences appear in those events. Select a behavior to inspect its entries and patterns more closely. Read the original event details alongside the tags. Tags group similar situations, while the text preserves details that may distinguish one event from another. You can correct the text and tags in the events table. Function coding groups consequence tags into categories used in later summaries. One ABC event can count in more than one category. Uncategorized and Consequence not recorded indicate that some coding information is missing. Review those entries before interpreting the counts. Use Activity to filter the entries and counts, then All activities to restore the full view. A behavior selection narrows the pathways and entries; Events by Behavior still shows all behavior counts for the selected activity. In ABC Entries, Group by: Time shows event order; Activity and Function group entries by those labels. One event can carry several tags, so tag percentages may add to more than 100%. Single-behavior pathways count entries containing each pairing; an entry can appear in several rows. Combined pathways divide an event’s contribution across its pairings, so counts may include fractions. Events missing a tag remain in the record and event total even when they cannot form a complete pathway. See Correct ABC details for the available text and tag edits. These patterns describe the events you recorded. A common consequence is not, by itself, evidence that it maintained the behavior. Consider the consistency of the sequence, the observation opportunities, and the other assessment information before drawing a functional interpretation.Frequency
Counts and Rates shows how many occurrences were recorded and their rate over the observation period. Rates help compare observations of different lengths, provided the behavior definitions and observation conditions are comparable. Event Record places the events on a timeline and shows the running total. Use Timeline to inspect or correct events. Gaps, when available, shows time between recorded occurrences. A gap marked ≥ reaches an observation or activity boundary and may be longer than the recorded span; those gaps are excluded from the average. If peer comparison was enabled, distinguish the student’s events from the peer’s events. A completed observation with no student occurrences has a student rate of zero. Sightline shows a peer rate only when at least one peer event was recorded during the observation; otherwise the peer result is unavailable. Interpret both findings in light of the time and conditions under which you observed. See Correct a Frequency event to change its time, behavior, or person, or delete it. The Gaps view uses recorded event times. The exported Distribution across the session text estimates gaps from counts grouped into intervals. State which measure you used; the grouped-count estimate is not the measured gap between two events.Duration
Duration by Behavior shows the total recorded time, percentage of the observation, and episode count for each behavior with recorded episodes. Average episode duration names the behavior to which that average applies. Use Episode Timeline to see when episodes occurred and whether different behaviors overlapped. Percentages belong to individual behaviors. If behaviors occurred together, do not add their percentages and treat the sum as the student’s total time engaged in behavior. An activity filter assigns an episode to the activity recorded at its start; an episode crossing an activity change is not split. The Episodes list lets you correct a recorded duration, add a missed episode, or remove an entry. Make corrections from your observation record, then recheck the totals. See Correct a Duration episode.Latency
Response Latency shows the mean and median time from cue to response. Latency by Trial shows the individual trials, making it easier to see whether a single long wait is influencing the mean. Trials marked No response are counted separately and excluded from the latency mean and median. They are not zero-second responses. Read the response-time statistics together with the number of trials without a response. When shown, First → last response compares the first and last trials with a recorded response in this observation. It does not describe every trial or a trend across observations. Use the Trials list to correct latency values or a trial’s response status. See Correct a Latency trial, including how to choose a response behavior and enter a latency when correcting a trial recorded as No response.Focus on an activity or behavior
When the controls are available, use the behavior choices and activity filter to narrow the view. Check the selected filters before describing a number, especially if you have moved between the whole observation and a short activity period. Filtering helps you inspect the record without removing the other data. Return to the full observation before deciding what belongs in the write-up, and review the export preview separately to check what it includes. See Track activity context for activity labels and Compare observations for looking across sessions.Write from the reviewed record
Select Write-up to open the document beside the results. In a narrow view, find it under More actions. You can write manually with Starter or Pro; AI writing requires Pro and AI setup. If you correct results while the Write-Up Workspace is open:- Finish the corrections.
- Select Back, then reopen Write-up.
- Check the updated observation details before inserting them, using AI, or exporting.
Saving fails in Results
If Results reports a save failure, keep it open and preserve your data before leaving:- Select Export → CSV to preserve the recording data. Use Export → Text as well if you need a text copy of the results and notes.
- Choose where to save each file, then open it and check that it contains the information you need. These exports are separate copies, not confirmation that the observation was saved in Sightline.
- If exporting fails or you cannot preserve the needed information, keep the screen open and contact support with the exact error message before leaving.